Van's homepage
A child exploring the world alone.
A brief walkthrough of (Köppen) climate classification - Preface
by Van
Note: In this article I would give a focused recap of contents from Wikipedia and introduce the viewpoint of data science on climate classification as a preface for my neural network based climate classification scheme.
Climate and biome classification
Climate classifications are systems that categorize the world’s climates. One of the most used is the Köppen climate classification scheme first developed in 1884 by Wladimir Köppen, which is further modified with Rudolf Geiger.
From an ecological point of view, we make climate classifications with the aim of indicating the local vegetation regime, since climate is a major influence on life in a region. These types of climate classifications focus on the effects of climate, so they are called empiric methods. The Köppen climate classification belongs to this category, and our discussion will focus on this category. It’s not very useful to mindlessly group climate statistics without a focus.
There’s another kind of climate classfications called genetic methods that focus on the causes of climate. They are from the perspective of meteorology.
It’s important to distinguish between climate classification and biome classification. Although closely related, their focus is slightly different. Climate classification should highlight local climate conditions (e.g., dry/humid, cold/warm, continental/oceanic), while biome classification tends to emphasize local vegetation (more precisely, potential natural vegetation that is the result of natural evolution without human intervention, e.g., tropical/subtropical/temperate forest/shrubland/desert…). This difference is reflected in our neural network scheme.
As an example, it’s reasonable to classify Northeast China and the Yangtze River Plain under the same biome category (temperate forest), but the climate conditions are markably different.
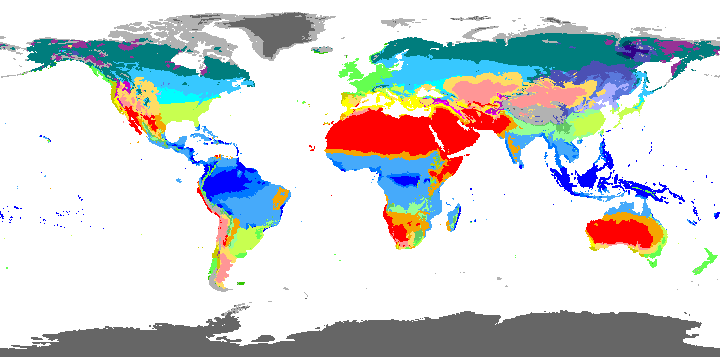
Köppen-Geiger climate classification map, 1991-2020 climate normals. Map coloring scheme (legend) is available in the link. Right-click for full image. (credit: Hylke E. Beck et. al (2023))
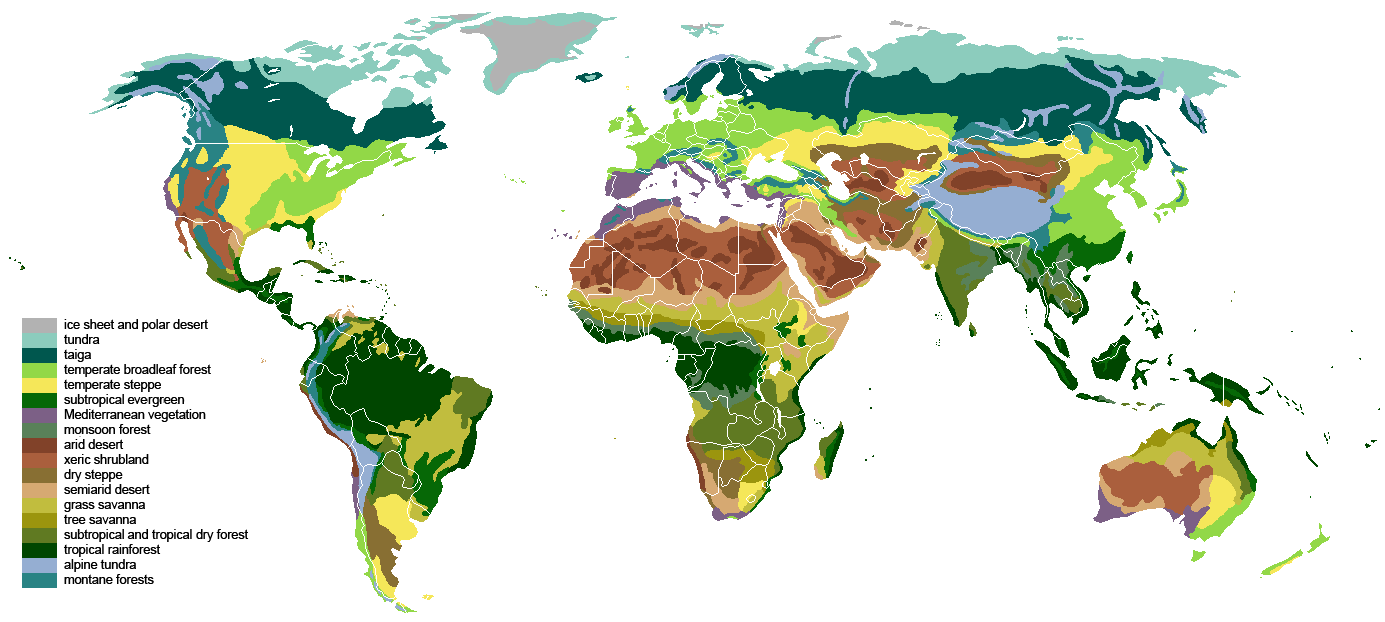
One way of mapping terrestrial biomes around the world. Right-click for full image. (credit: Ville Koistinen)
Köppen climate classification
Examples of commonly used empiric climate classification systems include Köppen-Geiger, Köppen-Trewartha, and Thornthwaite. They are a set of empirical rules that separate out different climate zones. From a machine learning perspective, the rules construct a decision tree. First, let’s take a quick walk through the Köppen-Geiger system to catch the idea of empirical climate classification system.
I would not dive into the detailed criteria for each subgroup. Interested readers may check the koppen_class function in the code snippet or Wikipedia for the details.
The Köppen climate classification divides climates into five main climate groups, with each group being divided based on patterns of seasonal precipitation and temperature. The five main groups are A (tropical), B (arid), C (temperate), D (continental), and E (arctic). E (arctic) is determined first by the summer temperature. Then, B (arid) is the special group whose criterion is a special threshold that quantifies aridity based on annual mean temperature, annual precipitation and precipitation seasonal pattern. If a location does not qualify for B or E, then based on the mean temperature of the coldest month, it falls into A (tropical), C (temperate) or D (continental).
The E (arctic) group is further divided into ET (tundra) and EF (icecap), based on summer temperature.
The subcategories of the B (arid) group are shown in the following table. W, S subcategories are based on the aridity threshold, while h, k subcategories are based on annual mean temperature.
| h hot | k cool | |
|---|---|---|
| W arid | BWh (hot arid, hot desert) | BWk (cool arid) |
| S semi-arid | BSh (hot semi-arid) | BSk (cool semi-arid, steppe) |
The B (arid) group
The A (tropical) group is further divided into Af (humid all year round, rainforest), Am (monsoonal), and Aw (dry-wet season, savanna), based on driest month precipitation.
The subcategories of the C (subtropical) group and the D (continental) group are shown in the following tables. a, b, c subcategories are based on summer temperature, while f, w, s subcategories are based on precipitation seasonal pattern. Dxd types occur only in Eastern Siberia, which experiences severely cold winters. The types in italics are rare.
| a hot-summer | b warm-summer | c cool-summer | |
|---|---|---|---|
| f humid | Cfa (humid subtropical) | Cfb (oceanic) | Cfc (subarctic oceanic) |
| w dry-winter | Cwa (subtropical monsoonal) | Cwb (subtropical highland) | Cwc |
| s dry-summer | Csa (subtropical Mediterranean) | Csb (oceanic Mediterranean) | Csc |
The C (subtropical) group
| a hot-summer | b warm-summer | c cool-summer | d severe-winter | |
|---|---|---|---|---|
| f humid | Dfa (humid warm continental) | Dfb (humid cool continental) | Dfc (subarctic continental) | Dfd |
| w dry-winter | Dwa (warm continental monsoonal) | Dwb (cool continental monsoonal) | Dwc (subarctic continental monsoonal) | Dwd |
| s dry-summer | Dsa (warm continental Mediterranean) | Dsb (cool continental Mediterranean) | Dsc | Dsd |
The D (continental) group
The Dsd type is not even found based on the climate dataset we used.
There are a total of 30 climate types defined in the Köppen-Geiger system. It may seem fractionated. The rare types have no clear climatic distinctions and are often omitted in climate study. Often researchers only care about the five major types, indicating that the subcategories are not so solid. There’s also no natural way to distinguish the highland type - it’s often mixed with types like ET, Dwc, Dsb. The B (arid) group may seem strange here because it’s not a representative of temperature level as other major groups do. Here are some other criticisms. We hope our method addresses them in a systematic fashion.
The data science perspective
The rules, empirically crafted by climatologists several decades ago, may not have a sound statistical basis on climate and vegetation data. Today, thanks to the advanced tools of data science and machine learning, the problem can be addressed in a more quantitative, intelligent and accurate fashion.
First, this is fundamentally an unsupervised clustering problem in the sense of machine learning, not a supervised classification problem because there are no true labels. Vegetation is not the true label because climate types are to be constructed, not given. We are actually seeking to cluster on something that bridges climate and vegetation up - so-called physiologically relevant climate variables by Alexandra S. Gardner et al. (2020). Summer/winter/annual mean temperature, driest month precipitation, etc. are all climate variables empirically constructed from the original climate normal data - monthly mean temperature and precipitation for each month. They can be obtained by max/avg pooling of the original data, which gives rise to the idea of using a neural network to accomplish this task - deep learning automates feature engineering.
Basically the method is a faithful translation of Köppen’s into deep learning. A neural network is designed to learn the mapping from climate data to vegetation distribution, and the intermediate layers contain the physiologically relevant climate variables (we will call them climate features afterwards) for clustering. Köppen studied the mapping with his knowledge and experience as a botanist, while we take advantage of the power of neural network. We use more natural clustering methods such as self-organizing maps and the crystal clustering I proposed as opposed to Köppen’s tree-like partitioning. Apart from temperature and precipitation, we will use another important climate variable in our method - the potential evapotranspiration (PET). This variable not only quantifies aridity by comparison with precipitation, but also takes into consideration many other important factors that affect plant growth, e.g. air humidity, wind speed, diurnal temperature range, solar radiation. Future projections (Young Hoon Song et al. (2023)) can be made under different social conditions (Shared Socioeconomic Pathways, SSPs).
tags:Wikipedia points out that a common shortcoming of climate classification schemes is that they produce distinct boundaries between the zones they define, rather than the gradual transition of climate properties more common in nature. Our method provides the continuously scaled climate features along with the intuitive and easy-to-understand climate types. Although neural networks are often accused of being black boxes, prominent climate features are interpreted with human knowledge in our method.